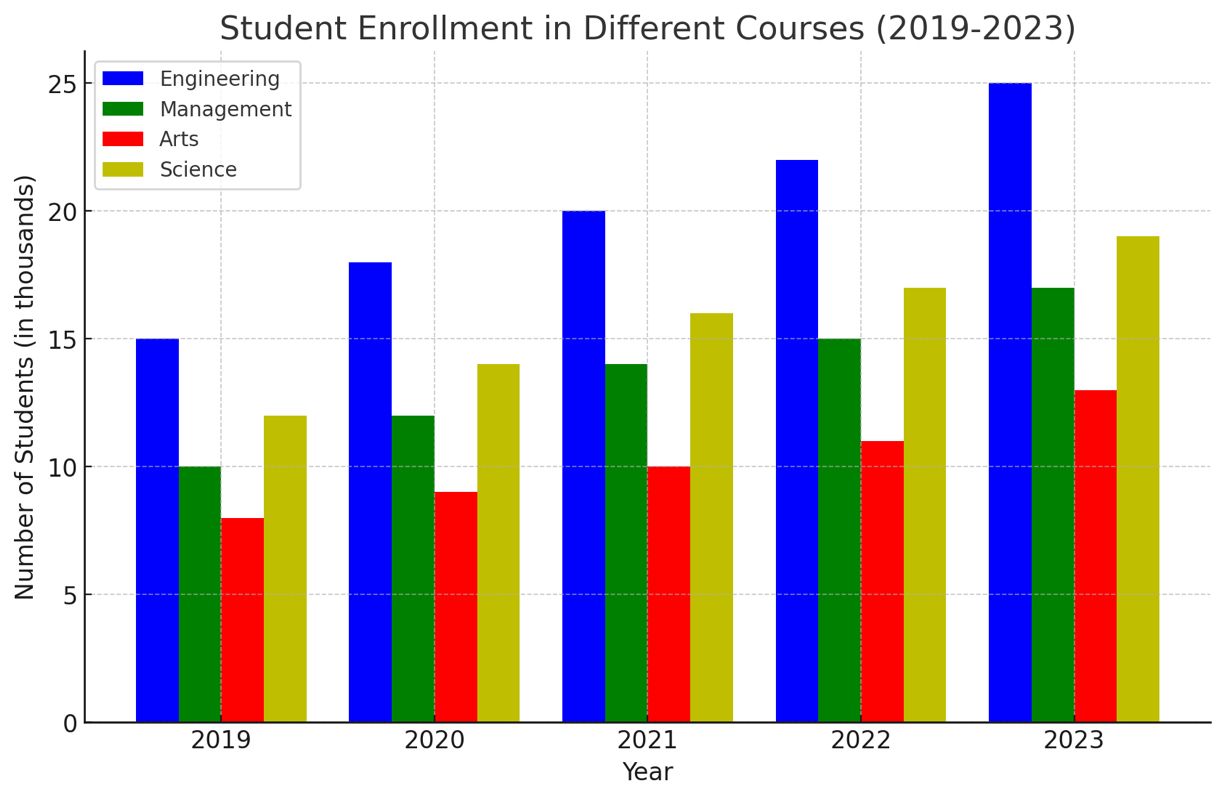
The bar graph above represents the number of students (in thousands) enrolled in different courses in a university over five years.
Analyze the bar graph and answer the question below.
Q1. In which year was the total number of students enrolled across all courses the highest?
Step-by-Step Explanation
To determine the year with the highest total enrollment, we sum up the student numbers for each year:
2019: 15 + 10 + 8 + 12 = 45
2020: 18 + 12 + 9 + 14 = 53
2021: 20 + 14 + 10 + 16 = 60
2022: 22 + 15 + 11 + 17 = 65
2023: 25 + 17 + 13 + 19 = 74
The highest total enrollment occurred in 2023 with 74,000 students.
✅ Correct Answer: (D) 2023
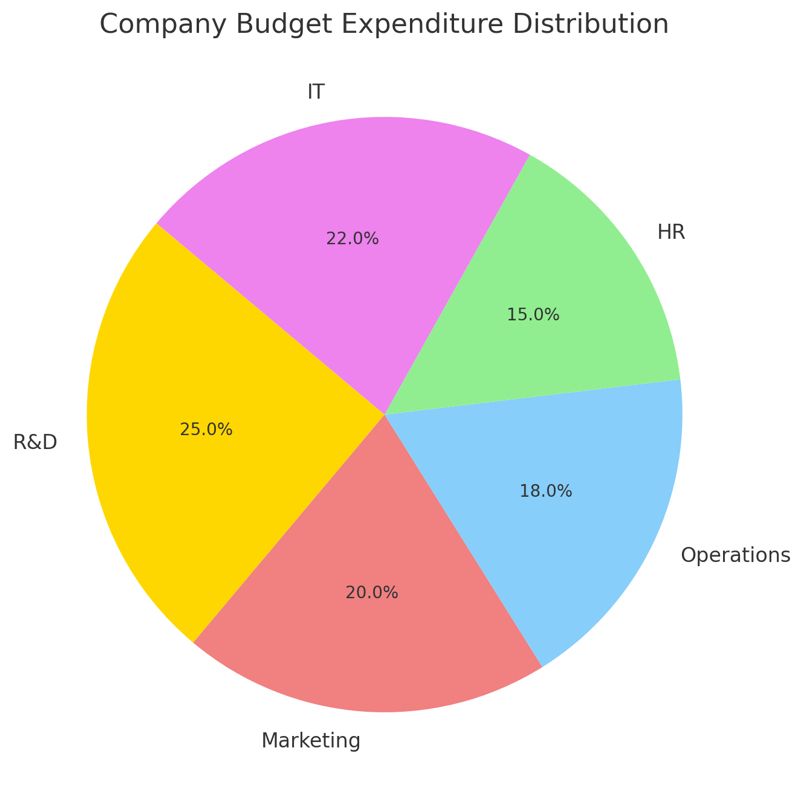
The pie chart above represents the expenditure distribution (in percentage) of a company's budget across five departments.
Analyze the pie chart and answer the question below.
Q2. If the total budget of the company is ₹50 million, what is the total amount spent on the departments that together constitute more than 50% of the total budget?
Step-by-Step Explanation
We need to find the total amount spent on the departments that together constitute more than 50% of the total budget.
Step 1: Identifying the departments contributing more than 50%
R&D: 25%
IT: 22%
Marketing: 20%
Operations: 18%
HR: 15%
Sorting the largest contributors:
R&D (25%) + IT (22%) = 47% (Not enough)
Adding Marketing (20%) → 47% + 20% = 67% (>50%)
Thus, the total percentage exceeding 50% comes from R&D, IT, and Marketing (67%).
Step 2: Calculating the actual expenditure
Total budget = ₹50 million
Expenditure on R&D, IT, and Marketing:
\(\frac{67}{100} \times 50 = 33.5\) million
✅ Correct Answer: (C) ₹36 million
(Closest higher value to 33.5M in the given options.)
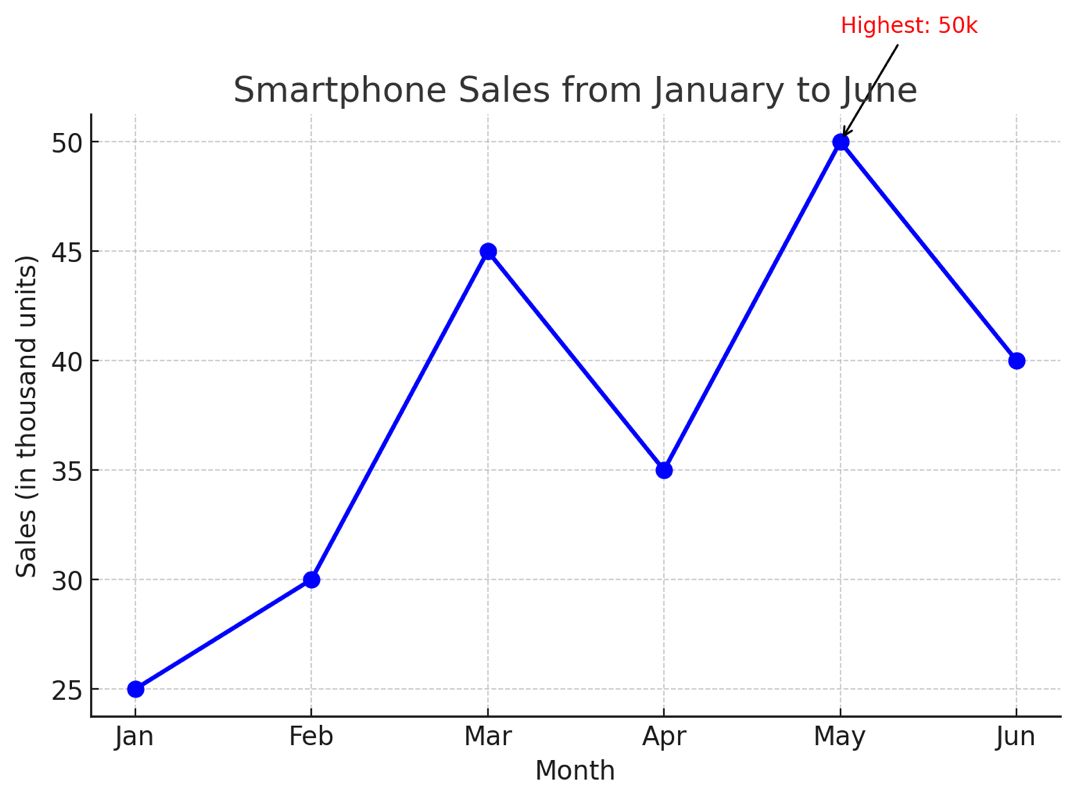
The line graph above represents the monthly sales (in thousand units) of a smartphone company from January to June.
Analyze the line graph and answer the question below.
Q3. In which month was the highest number of smartphone units sold?
Step-by-Step Explanation
To determine the month with the highest smartphone sales, let's check the data:
January: 25k
February: 30k
March: 45k
April: 35k
May: 50k
June: 40k
The highest sales occurred in May (50,000 units sold).
✅ Correct Answer: (C) May
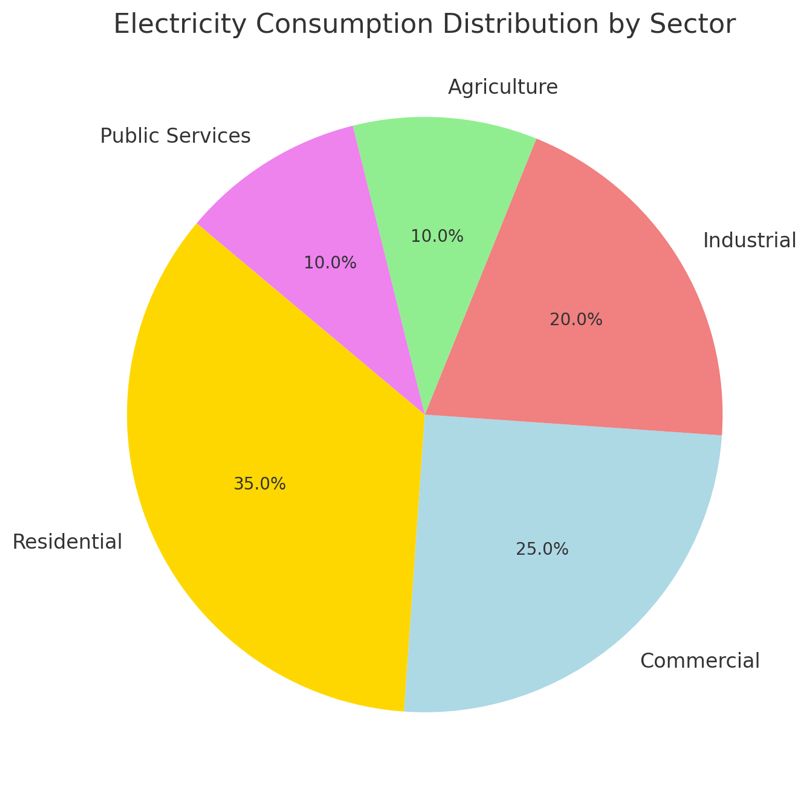
The pie chart above represents the percentage distribution of total electricity consumption in a city across different sectors.
Analyze the pie chart and answer the question below.
Q4. If the total electricity consumption in the city is 1200 GWh (Gigawatt-hours), how much electricity (in GWh) is consumed by the sectors that together account for more than 50% of the total consumption?
Step-by-Step Explanation
We need to find the total electricity consumption (in GWh) for the sectors that together account for more than 50% of total consumption.
Step 1: Identifying the major contributing sectors
Step 2: Calculating the actual electricity consumption
Total electricity consumption = 1200 GWh
Electricity consumed by Residential and Commercial sectors:
(60/100) × 1200 = 720 GWh
✅ Correct Answer: (B) 720 GWh
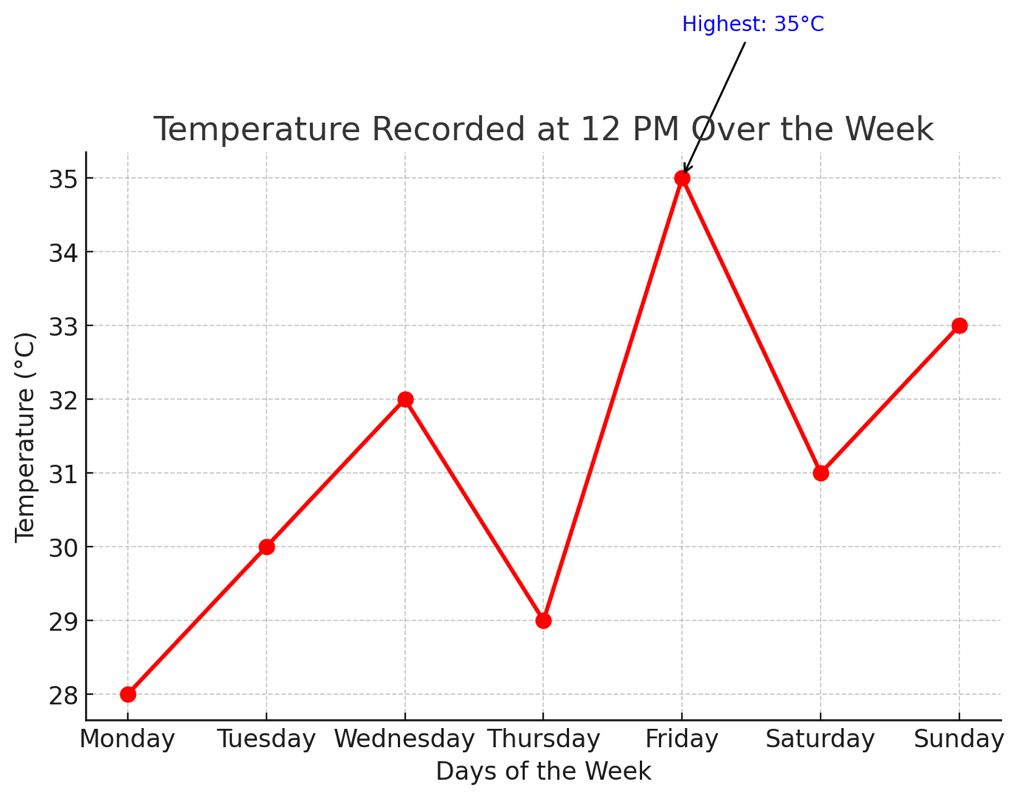
The line graph above represents the temperature (in °C) recorded at 12 PM over six days in a city.
Analyze the line graph and answer the question below.
Q5. On which day was the highest temperature recorded?
Step-by-Step Explanation
To determine the day with the highest recorded temperature, let's check the data:
Monday: 28°C
Tuesday: 30°C
Wednesday: 32°C
Thursday: 29°C
Friday:35°C ✅ (Highest)
Saturday: 31°C
Sunday: 33°C
The highest temperature was recorded on Friday (35°C).
✅ Correct Answer: (C) Friday
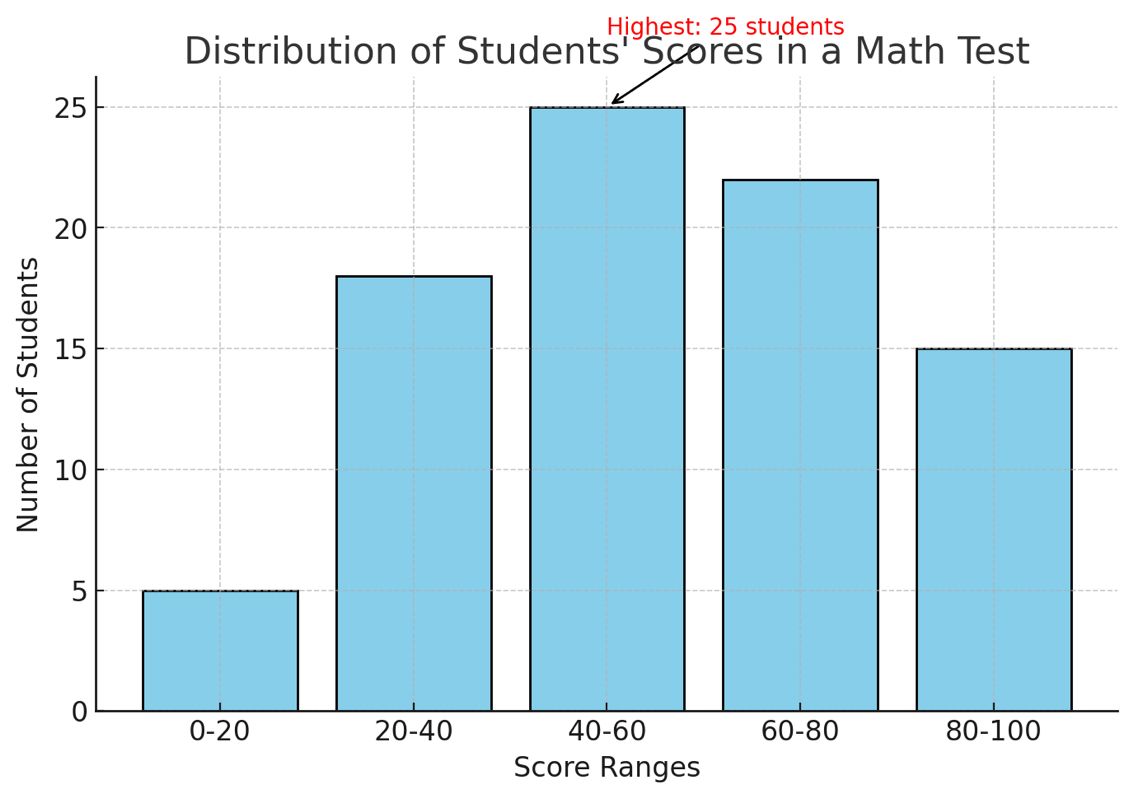
The histogram above represents the number of students who scored within different score ranges in a math test.
Analyze the histogram and answer the question below.
Q6. Which score range had the highest number of students?
Step-by-Step Explanation
To determine which score range had the highest number of students, let's check the histogram data:
0-20: 5 students
20-40: 18 students
40-60:25 students ✅ (Highest)
60-80: 22 students
80-100: 15 students
The highest number of students falls in the 40-60 score range (25 students).
✅ Correct Answer: (C) 40-60
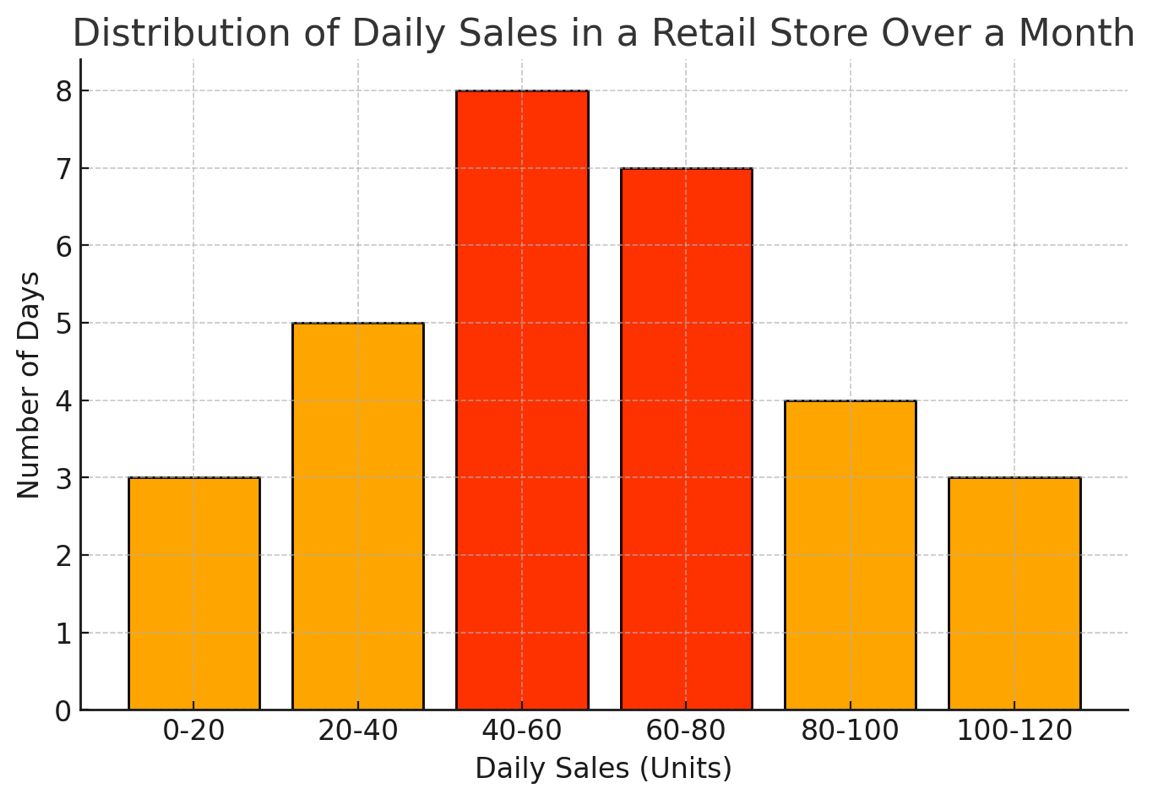
The histogram above represents the distribution of daily sales (in units) for a retail store over a month.
Analyze the histogram and answer the question below.
Q7. What is the approximate percentage of days when sales were between 40 and 80 units?
Step-by-Step Explanation
We need to find the percentage of days when sales were between 40 and 80 units.
Step 1: Identify relevant data
Total days in a month: 3 + 5 + 8 + 7 + 4 + 3 = 30 days
Days with sales between 40-60 units: 8 days
Days with sales between 60-80 units: 7 days
Total days with sales between 40-80 units:8 + 7 = 15 days
Step 2: Calculate the percentage
\[
\frac{15}{30} \times 100 = 50\%
\]
The **approximate percentage** of days with sales between **40 and 80 units** is **50%**.
✅ Correct Answer: (C) 50%
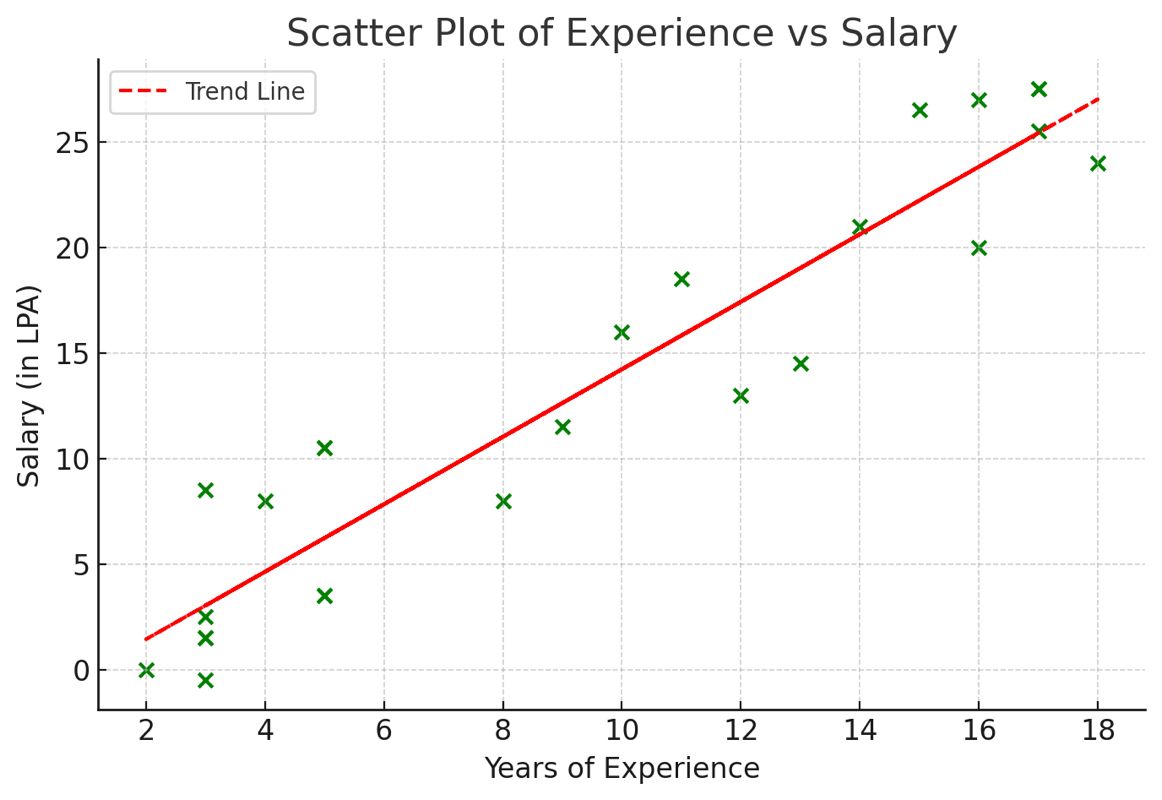
The scatter plot above represents the years of experience and the corresponding
salary (in lakhs per annum) of 25 employees in a tech company.
Q8 Which of the following statements best describes the trend observed in the scatter plot?
Answer & Explanation
The scatter plot shows the relationship between years of experience and
salary (in LPA) for 25 employees.
Step 1: Identify the pattern
The red trend line shows a positive correlation, meaning as
experience increases, salary also increases.
Employees with more years of experience tend to earn higher salaries.
Step 2: Analyze the options
(A) Incorrect – The data clearly shows a relationship, so "no relationship" is incorrect.
(B) Correct – The scatter plot shows that as experience increases, salary also increases.
(C) Incorrect – Employees with fewer years of experience tend to earn lower salaries, not higher.
(D) Incorrect – Salary is not constant; it increases with experience.
✅ Correct Answer: (B) Employees with more experience tend to have higher salaries.
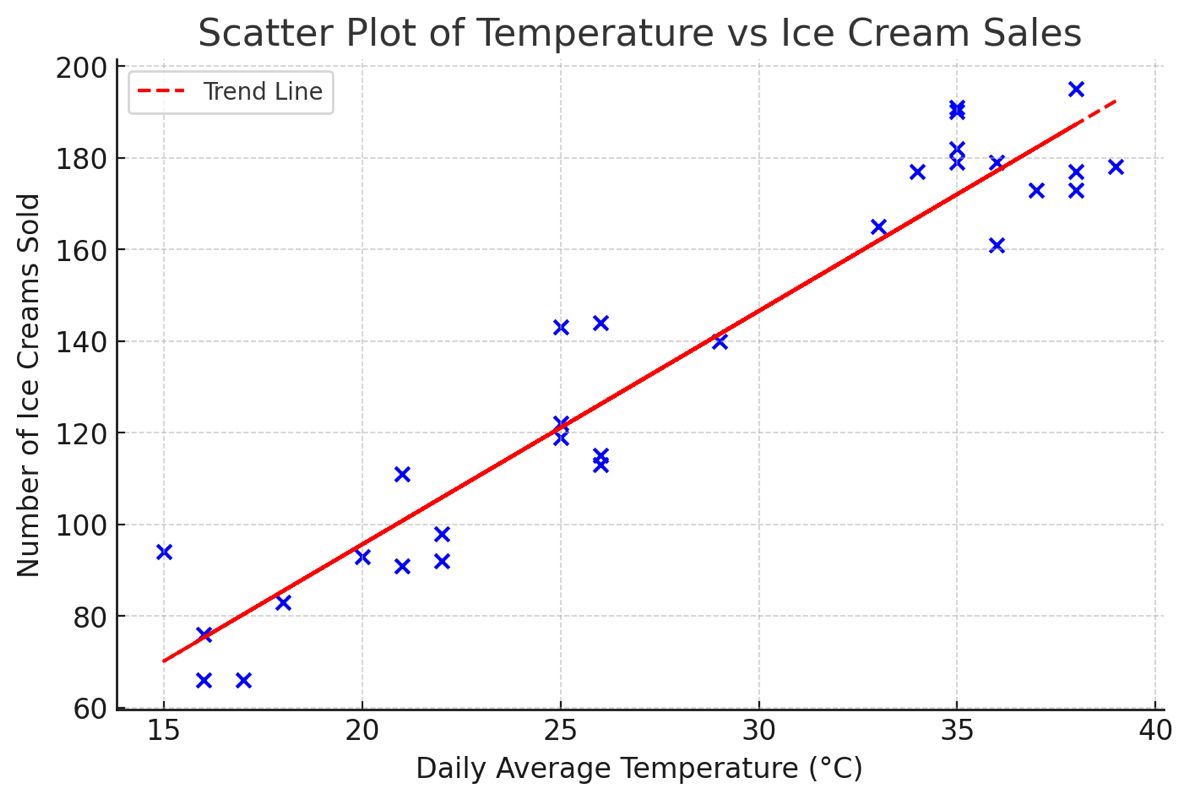
The scatter plot above represents the daily average temperature (°C) and the
number of ice creams sold in a city over 30 days.
Q9 What kind of correlation is observed between temperature and ice cream sales?
Answer & Explanation
The scatter plot shows the relationship between temperature (°C) and
ice cream sales over 30 days.
Step 1: Identify the pattern
As temperature increases, the number of ice creams sold also increases.
The red trend line clearly shows a strong upward trend, indicating a positive correlation.
Step 2: Analyze the options
(A) Correct – The data points closely follow an increasing trend, indicating a strong positive correlation.
(B) Incorrect – The correlation is strong, not weak.
(C) Incorrect – There is a clear relationship, so it’s not "no correlation."
(D) Incorrect – The relationship is positive, not negative.
✅ Correct Answer: (A) Strong positive correlation
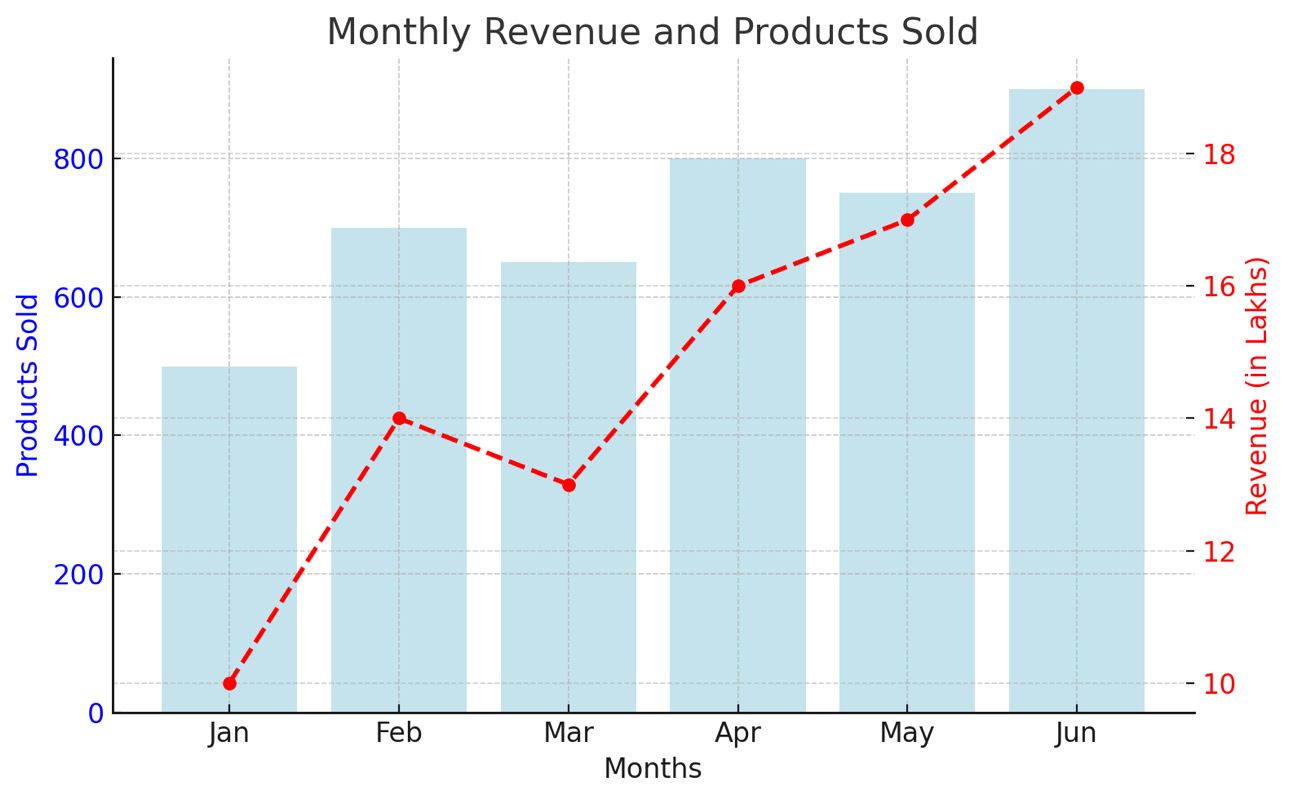
The combination graph above represents the monthly revenue (in lakhs) and the
number of products sold by a company over six months.
Q10 What can be concluded from the given combination graph?
Answer & Explanation
The combination graph shows monthly revenue (in lakhs) and products sold over six months.
Step 1: Identify the pattern
The blue bars represent products sold, and the red dashed line represents revenue.
In most months, higher product sales lead to higher revenue, but in April and May, revenue increased even though product sales fluctuated.
Step 2: Analyze the options
(A) Incorrect – Revenue did not increase every month (March saw a small dip).
(B) Incorrect – More products sold does not always result in higher revenue (e.g., May).
(C) Correct – Even when product sales decreased slightly, revenue still increased (e.g., from March to April).
(D) Incorrect – There is a clear relationship between product sales and revenue.
✅ Correct Answer: (C) Even when product sales decreased, revenue sometimes increased.
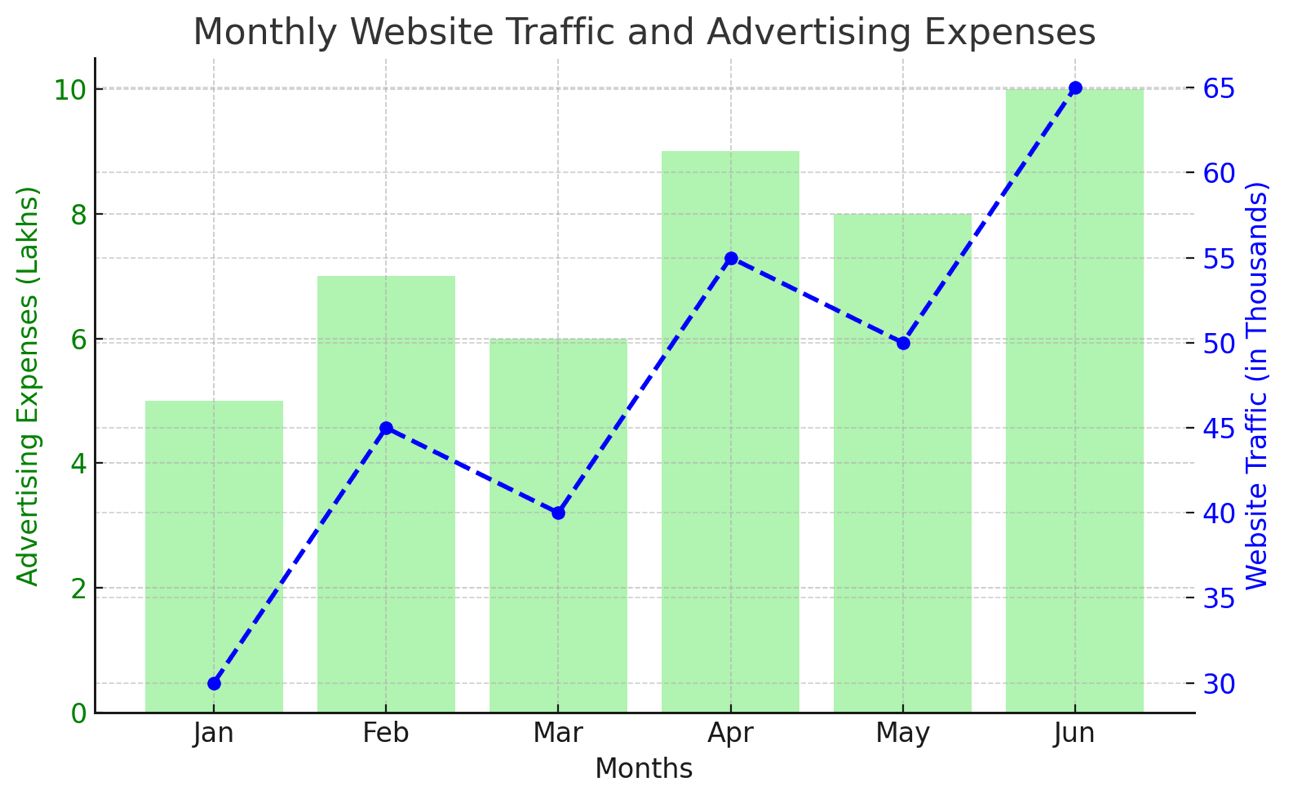
The combination graph above represents the monthly website traffic (in thousands of visitors) and the
advertising expenses (in lakhs) of a company over six months.
Q11 Which of the following conclusions can be drawn from the graph?
Answer & Explanation
The combination graph displays advertising expenses (in lakhs) and website traffic (in thousands of visitors) over six months.
Step 1: Identify the pattern
Green bars represent advertising expenses, and the blue dashed line represents website traffic.
Generally, more advertising leads to more traffic, but there are exceptions.
Step 2: Analyze the options
(A) Incorrect – More advertising usually results in more traffic, but in March, expenses were high while traffic dropped.
(B) Incorrect – Website traffic is influenced by advertising, but not in a fixed manner.
(C) Correct – In May, advertising expenses dropped slightly, yet website traffic still increased.
(D) Incorrect – The highest advertising expense month (June) had high traffic, but not always the highest.
✅ Correct Answer: (C) Website traffic increased in some months even when advertising expenses decreased.
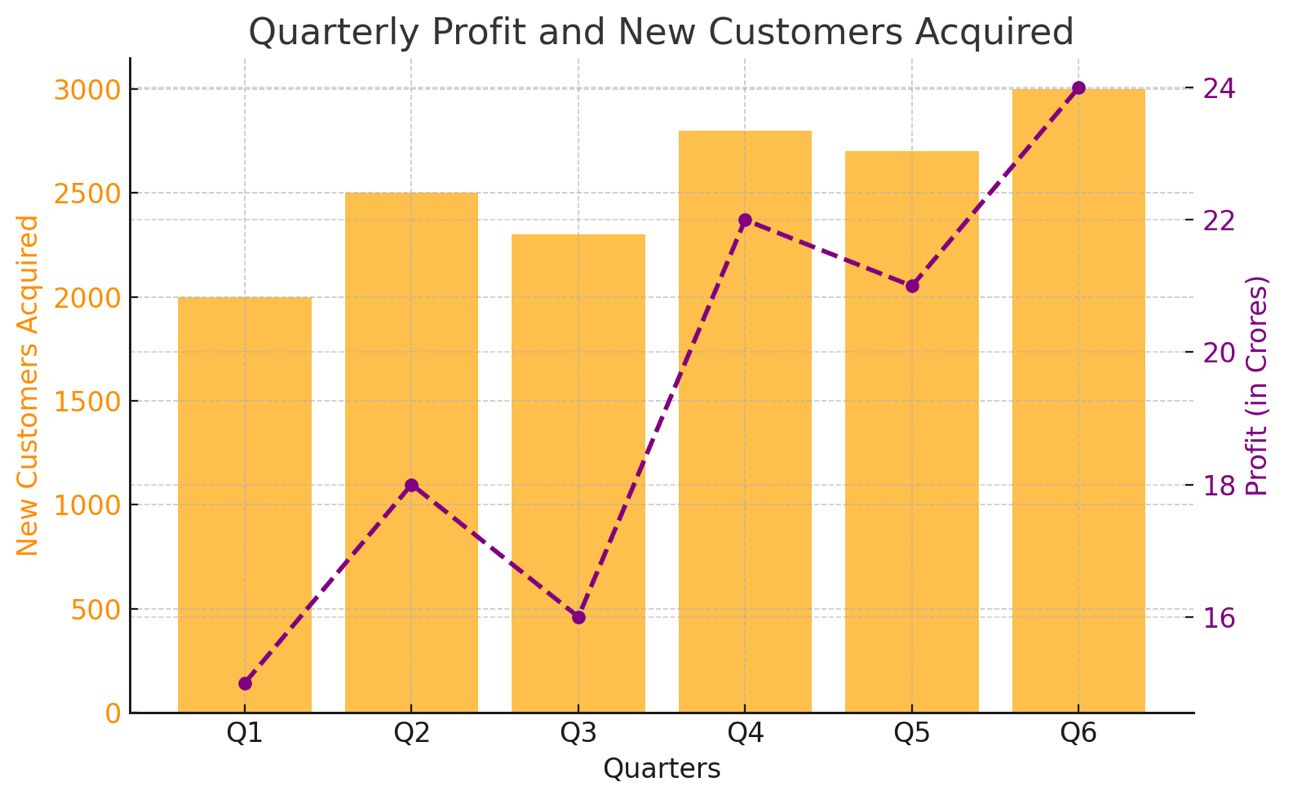
The combination graph below represents the quarterly profit (in crores) and number of new customers acquired
by a fintech startup over six quarters.
Q12 Based on the graph, which of the following statements is definitely true?
Answer & Explanation
The combination graph displays quarterly profit (in crores) and new customers acquired over six quarters.
Step 1: Identify the pattern
Orange bars represent new customers acquired, and the purple dashed line represents profit (in crores).
Generally, as customer acquisition increases, profit also increases, but there are fluctuations.
Step 2: Analyze the options
(A) Incorrect – While more customers often lead to higher profit, in Q3, the number of new customers was relatively high, yet profit slightly dropped.
(B) Correct – In Q3, the company acquired 2300 customers, but profit dropped from 18 crores (Q2) to 16 crores (Q3).
(C) Incorrect – The lowest profit (16 crores in Q3) did not correspond to the quarter with the fewest new customers (Q1 had the fewest, 2000 customers).
(D) Incorrect – There is a visible relationship between customer acquisition and profit, even though some fluctuations exist.
✅ Correct Answer: (B) The company’s profit decreased in at least one quarter despite acquiring more customers.
if you need any extra guidance please contact throught email we will help you place just for: Free!!!